By now, you are familiar with HR analytics and the important role they play, and indeed have always played, in the success of a business. Whether you are recruiting, hiring, or retaining employees, the right talent is a critical factor in the growth of your business.
One of the most powerful pivots businesses have made, in every industry from finance to coffee, from warehouses to theme parks, is to recruit and hire the employees that are already working for the business and have shown promise with the ability and interest towards upward career mobility. Then, those businesses work hard to train and retain those employees by keeping them engaged and satisfied in order to keep turnover down.
How do they do all this? With HR analytics.
HR analytics keep track of what your business needs, your metrics, and Key Performance Indicators, or KPIs, and how your employee experience is going so that your workforce continues to contribute to that need.
50 years ago, these analytics were done painstakingly with spreadsheets and pounds of paperwork, hours of human resources labor, and extensive management meetings and administrative work.
Today, you can cut the paperwork and manpower down with an automated HR Dashboard packed with HR metrics and charts, and a bevy of HR dashboard templates to help you create an HR Dashboard.
With HR Dashboard Software like Employee Cycle, this takes minutes, and our most popular HR Dashboard templates and HR dashboard examples include…
- All HR Metrics Dashboard
- Custom HR Metrics Dashboard
- HR Team Dashboard
- Recruting Dashboard
- Diversity Dashboard
- Part-time Employee Dashboard
- HR Dashboard for CFOs and the Finance Department
- HR Dashboard for Board of Directors
- HR Dashboard for Investors
What Is an HR Dashboard?
Simply put, an HR dashboard is a single source of truth for HR. An HR Dashboard is a software system that compiles all your HR analytics information into one place and provides you with a single visual shot of a particular HR metric.
HR Dashboards interface with all of your existing HR systems, from hiring to payroll to employee engagement.
What Should an HR Dashboard Contain?
Typically, you want your HR Dashboard to contain all of the information that will enable your business to run at its optimal performance level. Several factors contribute to the success of your business as it relates to your human resources, and understanding how they interact with each other can help you maximize your labor capital.
Remember that the best HR dashboards will allow you to compare and contrast data from across your disconnected HR systems, allowing you to not only see what has happened in the past and what is happening right now at your company but also to make predictions for the future so you can make the best decisions possible for your company.
Important HR metrics that should be included in your HR Dashboard:
- Time to hire
- Time to productivity
- Voluntary turnover
- Promotion rate
- Span of control
- Compa-Ratio
- Salary range penetration
- Total compensation spend rate
- New Hire Turnover
- Training Completion Rate
- Healthcare usage by plan
- Cost-per-hire
- Time to fill
- Offer acceptance rate
- Employee satisfaction rate
- Retention rate
- Absence rate (Absenteeism)
- Overtime hours
- Revenue per employee
- Performance
- And more HR metrics
Having these example HR metrics produce HR analytics at your fingertips, in real-time, and allows you the kind of HR data visualization we simply did not have access to even a decade ago. Today, you can look at a single HR Dashboard, according to your HR Metrics and KPIs, along with the rest of your team, and make smart, evidence-based decisions that will lead your company into the future.
Top 5 Examples of an HR Dashboard
The nice thing about HR Dashboards is that you can easily change your metrics to see different snapshots. For example, if you want to see employee satisfaction or employee turnover, salary, or revenue per employee, you could simply pull that data into a single source of HR truth, or HR dashboard. In this way, your HR dashboard will help you use your existing HR data, make predictions for the future, and help you meet your business and workforce objectives.
Common HR Dashboards are used by management and HR managers alike to ensure proper recruiting, hiring, training, and retention of employees as those metrics are high-priority key performance indicators (KPIs).
The top 5 most common HR Dashboards are:
1) Diversity
It has become common knowledge the most successful, productive, and profitable companies integrate diversity as a primary factor in their hiring and retention decisions. Diversity of perspectives allows for a dramatically richer and more engaging customer experience, and keeping your staff at all levels, from top executives to the mailroom, will ensure that level of diverse perspectives.
The Diversity Dashboard will allow you to see the trajectory of your recruiting, hiring, and retention based on age, gender, and ethnicity.
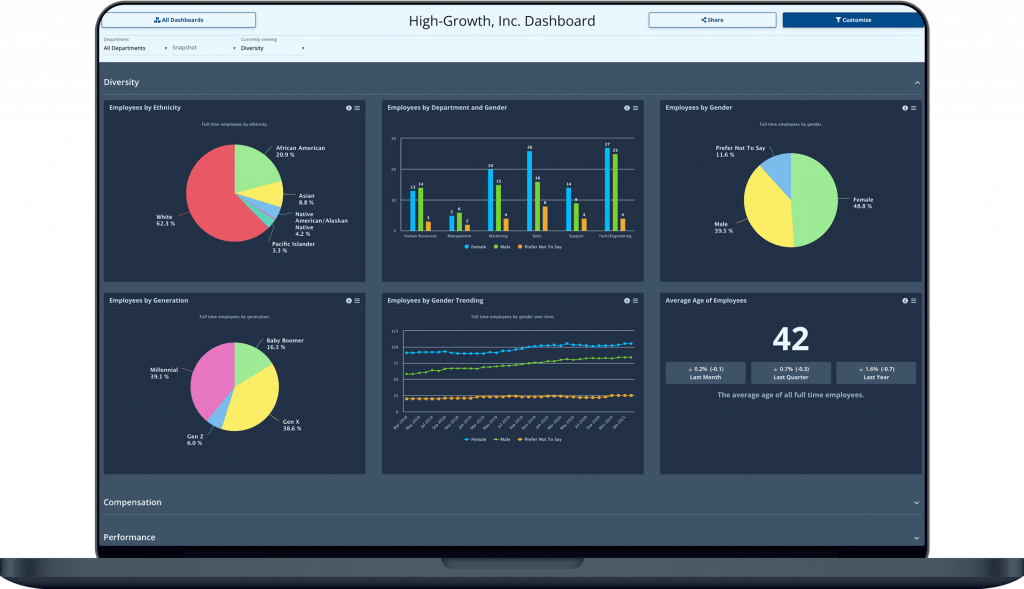
Depending on your HR system and using the Employee Cycle software, the following diversity metrics are available in the click of a button:
- employees by gender
- employees by gender over time
- employees by generation
- employees by ethnicity
- employees by department by gender
- employees by level by gender
- employees by level by diversity
- employees by level by age
2) Recruiting
How much are you spending on advertising for new employees? Where are you spending that money? And is it paying off?
A Recruiting Dashboard will help you maximize your spending and make sure you are not simply throwing money down a hole that is not providing a reliable return.
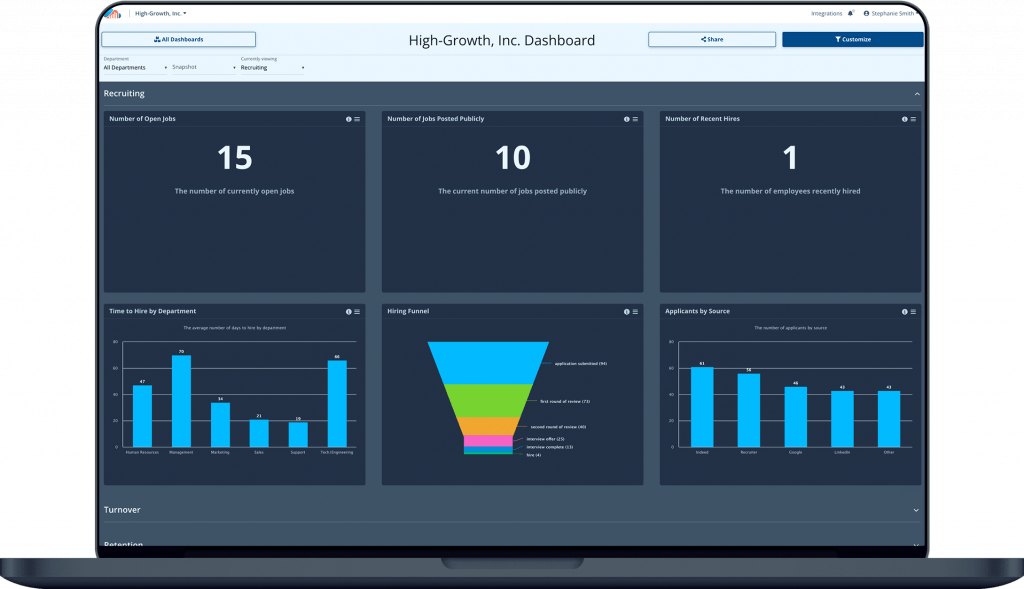
The following recruiting HR metrics are available in the click of a button in Employee Cycle:
- # of open jobs
- number of recent hires (time stamp / trending)
- speed by hire
- hiring funnel
- applicants by source
3) Turnover
Do you know how long your employees stay with your company? Do you know why?
A Turnover Dashboard can compile HR analytics that includes issues like salary, benefits, length of employment, and employee satisfaction, among other HR metrics to help you get a clear, evidence-based look at what you’re doing, or failing to do, to keep your best employees safely ensconced within your walls and not headed off to the competition.
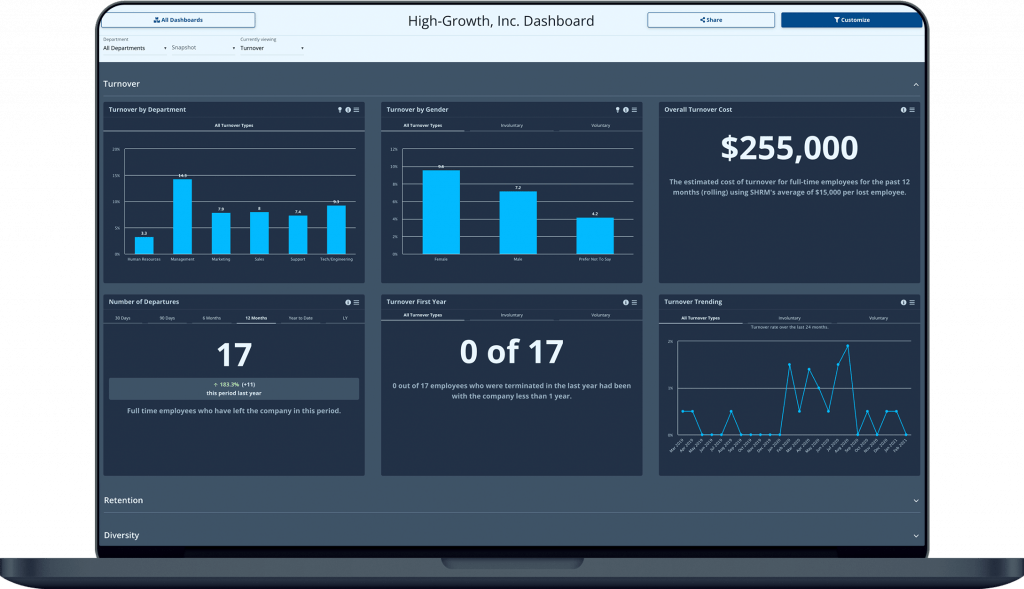
The following turnover HR metrics are available in the click of a button in Employee Cycle:
- overall turnover rate
- annualized turnover data
- 1st year turnover (YoY)
- turnover by gender
- turnover by ethnicity
- turnover by age
- turnover by level
- turnover (voluntary versus involuntary)
- turnover cost
- turnover cost projected annually
4) Retention Dashboard
Data is critical to be efficient and effective at retaining employees. And the best way you can do this is by leveraging your HR data in one single source of truth, or HR dashboard, so you have the right metrics and HR analytics solution in place. Once you do, this information provides valuable insights to help your leadership team develop workforce strategies to improve employee satisfaction and increase employee retention.
Using the Custom HR Metrics Dashboard template from the Employee Cycle HR Dashboard platform, you can create a near real-time, custom Employee Retention Dashboard in just a few minutes.
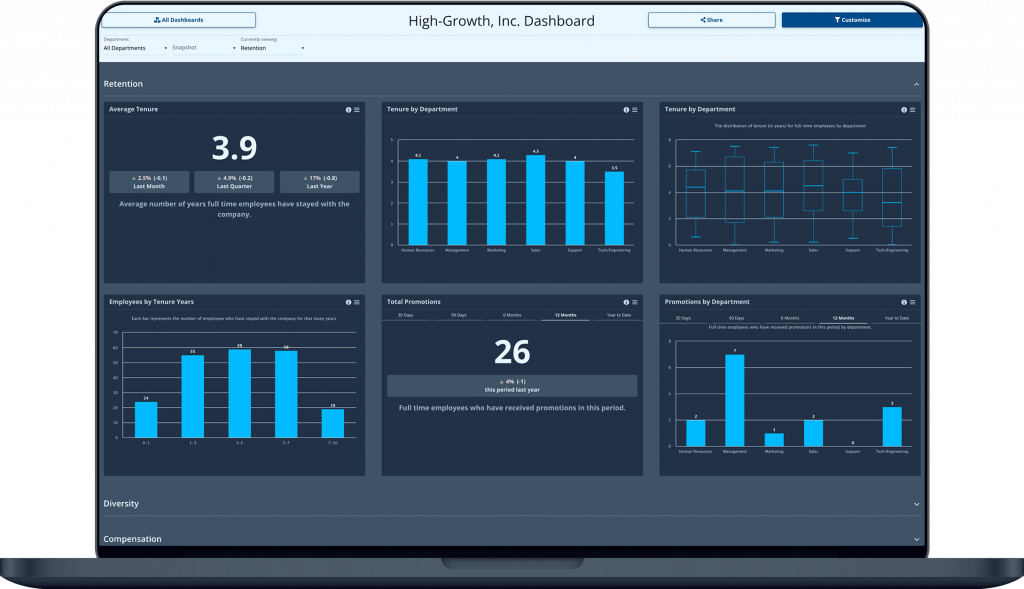
The following turnover HR metrics are available in the click of a button in Employee Cycle:
- average tenure
- tenure by department
- tenure by age
- tenure by ethnicity
- # of total promotions
- # of promotions by department
- # of promotions by location
- # of departures in total
- # of departures over time
- # of departures by department
- # of departures by level
- # of departures by location
- # of employees by tenure cohorts (ex: “< 1year”, 1-3 years, 3-5 years, > 5 years)
Learn even more about increasing retention and using HR analytics here.
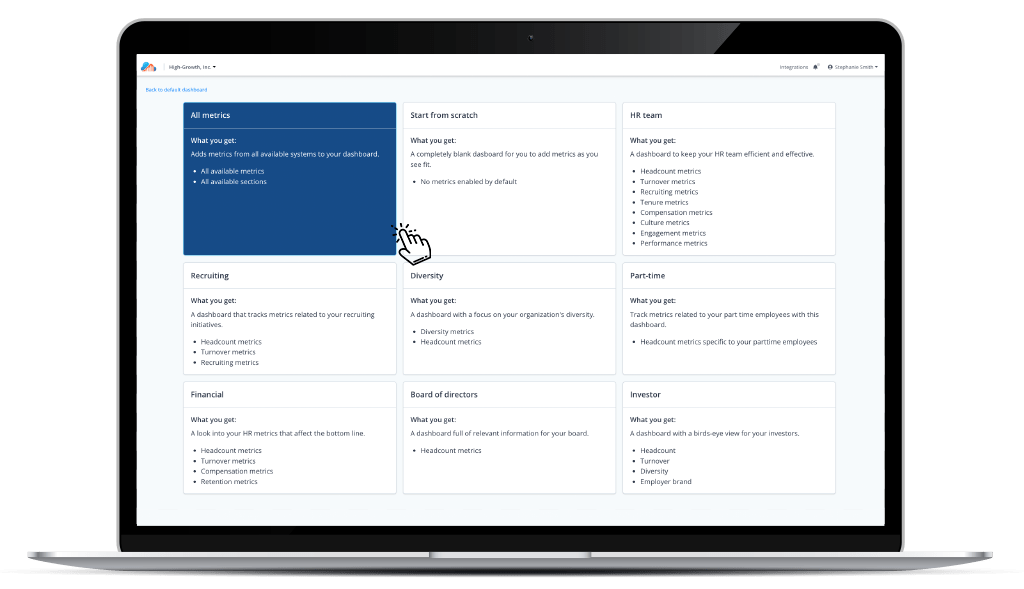
5) All HR Metrics Dashboard
As the heading suggests, this includes all available HR metrics and KPIs an organization has for every step of the employee lifecycle, which can be visualized and subsequently analyzed to make evidence-based decisions.
You’ll still be able to customize what metrics appear in your dashboard later when using this dashboard template and it adds metrics from all available systems to your dashboard.
Employee Cycle HR Metrics Dashboard Demo
At Employee Cycle, we have the most innovative HR technology to integrate most HR systems into a single source of truth in a dashboard with the HR metrics you want.
Our HR metrics dashboard software, also known as the world’s first Employee Data Platform, is user-friendly and comes with your own HR coach (for plans) to help you regularly navigate into an area that is unfamiliar to you.
“Employee Cycle gave us tools at our fingertips to justify what we know in our gut is the right thing to do. That’s been huge for us. As an HR professional over time, you can develop a ‘spidey sense’ or a ‘third eye’ for what you know your organization needs. But what’s been beautiful about Employee Cycle is that they’ve actually provided me with the data and the research that I need to show our executive team to demonstrate that what we’re asking for will enable the business to grow.”
Amanda McNeil, HR Manager
Employee Cycle’s HR Dashboard integrates effortlessly with your existing HR systems, and you can customize your dashboards in any way that feels visually appealing to you,
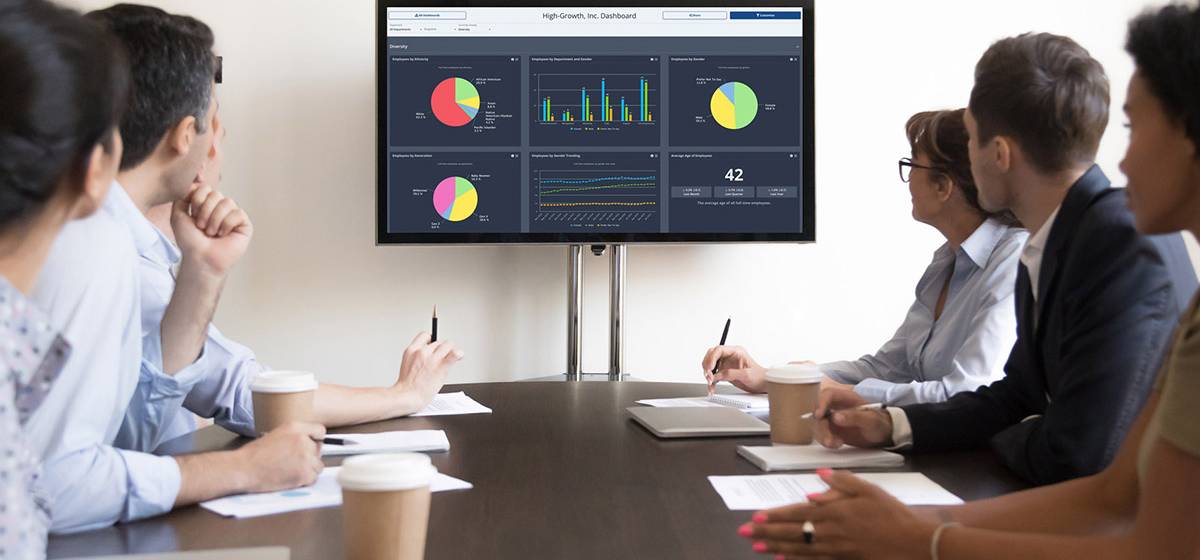
You can also share your dashboard in meetings, on TV Dashboards, and across departments so that everyone in your company is on the same page. Shared mission and understanding, backed by evidence, are a fundamental part of overall progress and success and the Employee Cycle HR Dashboard helps you get in just a few clicks. Seriously.
Find out how Employee Cycle can help with creating your own HR Dashboard
Employee Cycle’s initial set-up and HR data coaching sessions (for paid plans) will talk you through how to integrate your current HR software into the one-stop-shop that is Employee Cycle’s dashboard.
No more complicated reporting where you have to download reports from multiple systems and try to figure out which data is relevant from which report; with the combined dashboard, you can generate one meaningful data-driven report to share with relevant stakeholders.
If you want a way to simplify your HR data and remove the complicated, arduous, and time-consuming reporting process, schedule your free demo today.