
As most human resources professionals will attest, the business of managing people is anything but routine. That’s why they enjoy the work so much. Talk to anyone working in HR and they will tell you that no two days are alike. An HR managers’ overall role is to keep employees engaged, happy and motivated so that they are aligned with the goals of the business.
A morning may start with going over emails, triaging tasks such as payroll issues or requests made earlier from other time zones. Later in the morning, an HR worker could be walking the floor to show support to the employees. The afternoon could bring drop-in counseling for an executive. Then there is the task of recruiting. Depending on how many open positions need to be filled, an HR manager could spend a big chunk of time wading through resumes, reaching out to candidates and interviewing.
The rest of the day’s work may revolve around meetings, training sessions, or preparation for both. Once in a while, they return to their office to find a resignation letter. How many of the day’s decisions have been made using reliable data? Unfortunately, the answer is probably not much.
If you have been working in Human Resources for years, you know the field is changing fast. It was always focused on people, but data and numbers have started to drive decision-making in a way that has never been seen before. Dashboards are all the rage. The business that has always been focused on people now uses technology and data analytics rather than pure intuition to strategize its moves.
There are many different ways to capture, measure and use data as it relates to HR, but what aspects of HR data are the most important? We review several ways to approach what analytics are important in HR and where to start, below.
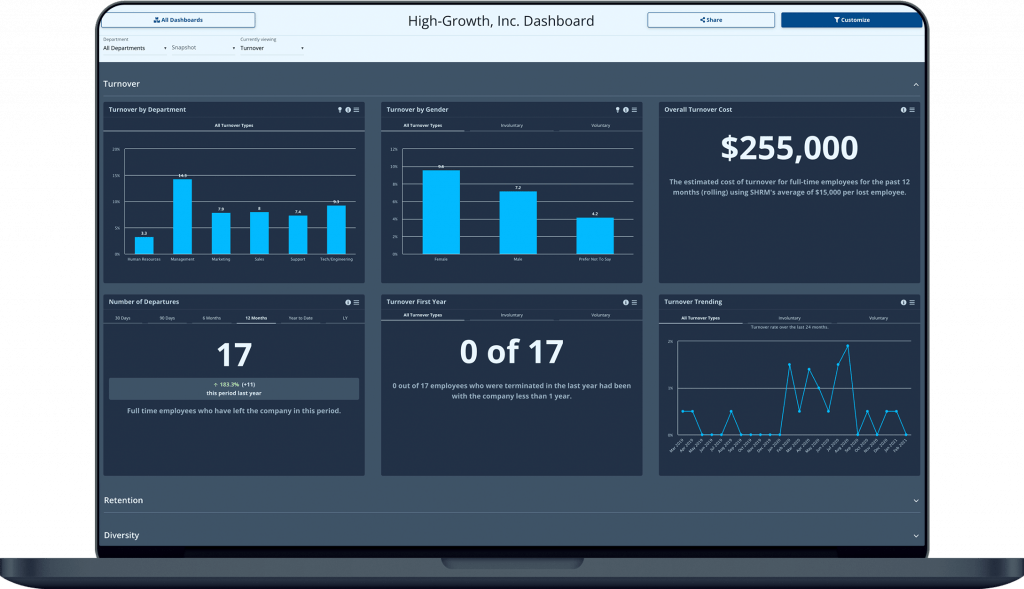
Getting started by measuring turnover and retention data
Turnover, or the number of jobs that are vacated within a set amount of time, can be measured within different parameters. With data, you can see the number of employees who quit a position within the first year of employment. Turnover can further be analyzed when you compute the cost-per-hire, and see how much money that may be taking from the organization if positions are turning over too often.
Retention is another valuable metric to have. In short, retention is the opposite of turnover: A company’s ability to hire and keep employees working over a set period of time. One factor that can help analyze retention rates is salaries. Salary data will show you any correlation between salary level and retention. Another popular metric to gauge is the benefits participation rate. If your employees aren’t taking advantage of the benefits you offer, it’s worth analyzing the benefits and whether you can improve them to keep good employees.
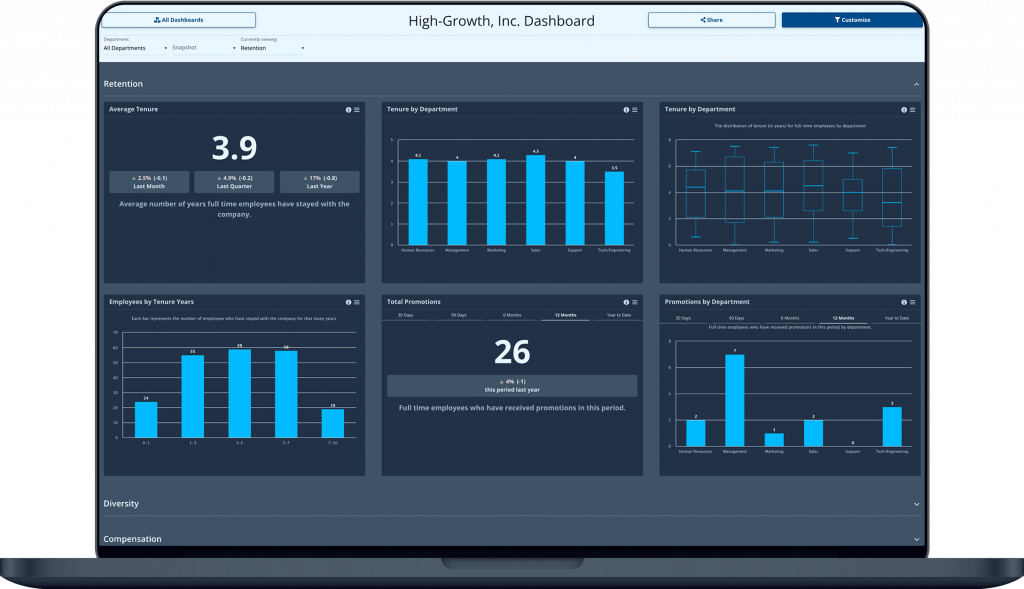
You can dig deeper into data to mark how many positions are filled or steady by the manager. If any one manager is bleeding employees, it’s time for a talk. This correlates to span of control, and data can help with that too. Span of control is a term that describes the number of subordinates that each manager can effectively lead.
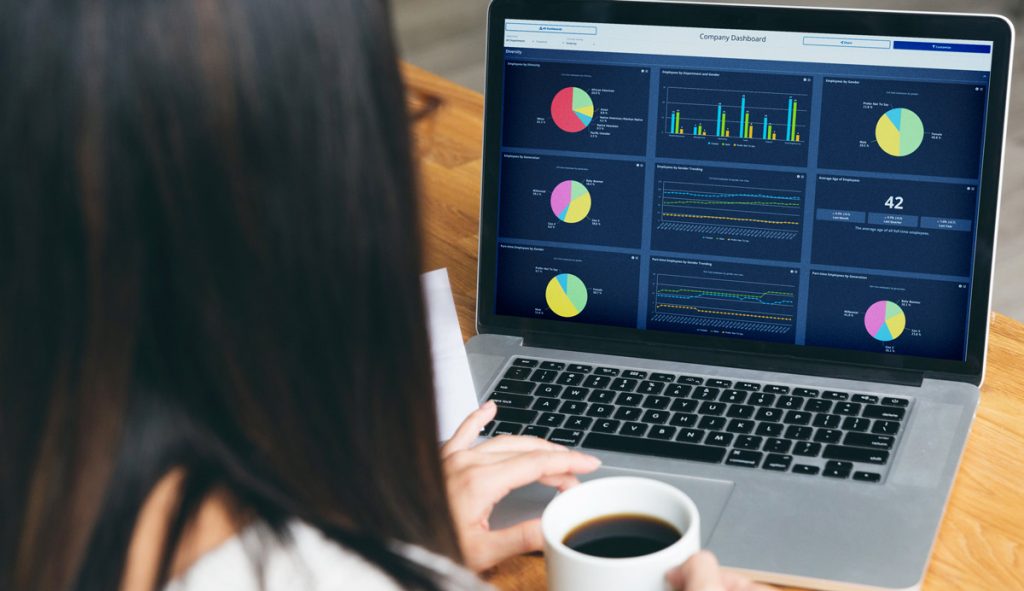
Don’t forget about DEI (diversity, equity and inclusion) metrics
There is so much talk about DEI in today’s business world that companies need to strive for action rather than words. Studies have shown that women, minorities and the disabled are underrepresented in leadership roles at Fortune 500 companies across the United States.
Not only that, but even with this knowledge, it is changing slowly. In a 2020 McKinsey study, companies surveyed with 15 percent female leaders in 2015 had risen to only 20 percent by 2019. It’s easy to look at your company and think of it as diverse. You may see employees of different age groups, ethnicities, and physical abilities. But numbers don’t lie. If you have data on your management positions and higher, and not one manager is female, or a minority – that affects the entire company.
Employees grow and aspire to higher positions when they see someone like themselves who has earned that level of promotion. Having your actual data on DEI is the first step to creating a DEI program that can adequately address any disparities in your company.
Why use HR data in today’s world
Most human resources departments are comprised of generalists, and managers – all of whom are required to have many different skill sets and switch tasks daily. Rarely does an HR department have any full-time HR analysts—employees dedicated to data, or data analytics. Data can come from different HR and tracking systems and 100 Excel CSVs may need to be cleaned up before they can be analyzed, such as with VLOOKUPS. And it may not even be 100% accurate, as a customer who saved 6 hours per week automating their HR analytics process told us. Rather than taking immense amounts of time on a project that size, some of your data-driven peers, like People managers at Axios and Agora, opt to leverage a data coach.
There are many reasons to use data in HR, and the most often cited is to improve the employee experience. Data can show if your staff has a sense of belonging, and enjoys the company culture. Another is to improve employee training, which in turn saves time and improves productivity. The more data is driving your workplace decisions, the more you can focus on core products and innovation.
HR should be part of the business, not separate from it, said Tracy Cote, chief people officer of StockX, an online marketplace based in Detroit. She said the employee experience is about making sure people can bring their whole selves to work, from pre-hire to retirement. Ideally, your workplace is where employees can be authentic and engaged. “If you have the right philosophy, you can do amazing things,” she said.
Employee Cycle is changing the way HR leaders use data! We change their disconnected employee data into a user-friendly, centralized, and real-time people dashboard. We help companies view, track, and analyze their workforce data in one place. As a result, companies avoid risks, save costs, and increase their employee lifetime value.
Create your free account today by scheduling a demo. Or, follow us on LinkedIn for more great tips about how to leverage HR data.