4.8
")
| The #1 Plug-and-Play UKG BI Solution
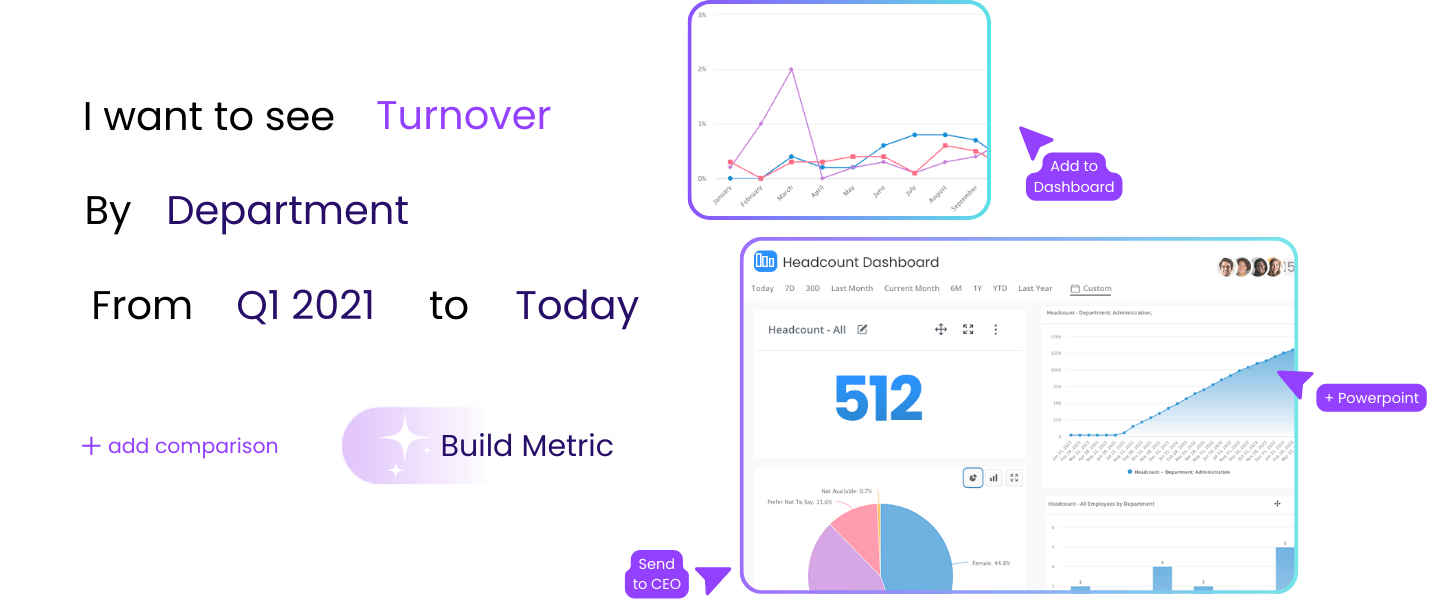
Plug & Play Workforce Reporting
Plug & Play Workforce Reporting Dashboards Analytics Insights
Connect UKG, ATS, and HR systems to get real-time dashboards and reports—without BI, SQL, or spreadsheet chaos
Join our growing customer community powering workforce analytics for 1M+ employees


WHAT WE OFFER
Meet Plug & Play BI.
Designed for HR
Your no-code analytics companion.
Higher Data Confidence
Standardized formulas + automated data quality checks to improve accuracy and completeness.

Reduction in Ad-Hoc Report Requests
When leaders can self-serve dashboards and drilldowns, HR report builders spend dramatically less time responding to “Can you pull this for me?” emails.
Less manual rework
Core workforce metrics are already calculated and reusable (turnover, headcount, DEI, tenure, etc.),

More Reporting Coverage With the Same Team
No-code reporting allows even non-technical HR staff to create dashboards and metric views — expanding reporting capacity without hiring additional analysts.
The HR Tool Everyone’s Talking About.
The HR Tool Everyone’s Talking About.
Built for HR teams who need answers fast.
Employee Cycle makes workforce insights easy to build, easy to share, and easy to trust—without BI complexity or technical hurdles.
15 Sec.
Companies take up to 15 seconds on average, not days to create a new multi-filter report view
85%
Companies choose Employee Cycle for Ease-of-use.
5 Days
Companies say Employee Cycle delivers value in less than 5 days after onboarding, not months.
75%
Companies feel HR is 75% more strategic and data-driven with Employee Cycle.
If you can click, you can build.
Industry: Banking
Headcount: 2,500+
Operational Wins on Autopilot
Operational Wins on Autopilot!
No More Pivot Tables!
Eliminate manual reporting.
Replace VLOOKUPs, pivots, and spreadsheet merges with automated, refreshable reporting.
Automate your HR data loop
Stop stitching reports together and starts answering workforce questions in real time.
Connect HR Data Silos
Stop stitching reports together and starts answering workforce questions in real time.
Real-Time Data Visibility
Providing leaders with instant access to workforce numbers rather than waiting for weekly or monthly manual report distributions.
Stakeholder Self-Service
Empowering department heads, division managers, and plant managers to access their own filtered dashboards and answer workforce questions independently
Data Quality Auditing
Performing “garbage in, garbage out” checks to identify missing or incomplete fields (e.g., ethnicity or location) to ensure high data integrity
Workforce reporting that moves at leadership speed
Connect your HR data and get executive-ready dashboards in 1 day. Then build new cuts in clicks—by manager, tenure, job family, location, pay band, or demographics.
The “Why Is This Happening?” Problem
What's hard today?
Why Employee Cycle
Our Value
The “Why Is This Happening?” Problem
What's hard today?
Why Employee Cycle
Our Value
The “Why Is This Happening?” Problem
What's hard today?
Why Employee Cycle
Our Value
The “Why Is This Happening?” Problem
What's hard today?
Why Employee Cycle
Our Value
Learn How To Automate Your HR Analytics and Reporting Process
See your data in Employee Cycle—fast