

Launch date: January 4, 2023
Unlocking Deeper Insights: Introducing the New 'Compare' Feature to Find Metrics
In a world fueled by data, the quest for meaningful insights has become more essential than ever. Businesses, researchers, and decision-makers rely on data-driven insights to navigate complex challenges and make informed choices. With this in mind, we are thrilled to unveil a powerful enhancement to Find Metrics: the innovative ‘Compare’ feature. This new addition promises to revolutionize the way you explore and comprehend data, enabling you to generate deeper, more contextual insights that drive impactful decision-making.
The Power of Comparison
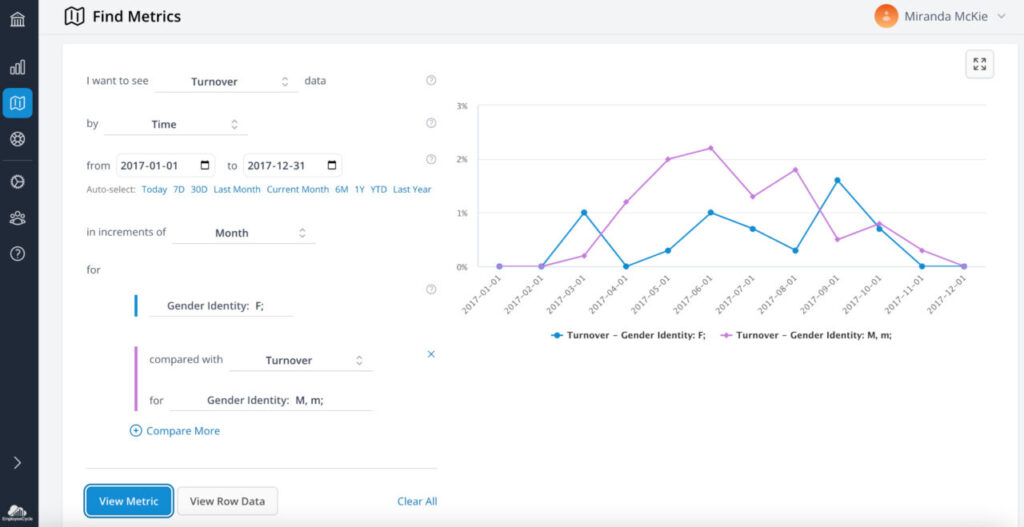
Data analysis goes beyond numbers—it’s about understanding patterns and relationships. With ‘Compare,’ you can now go beyond single metrics and gain deeper insights through comparisons. Imagine you’re a marketing manager analyzing turnover rates for women and men in 2022. By comparing these rates side by side, you can identify trends and disparities that demand attention.
Unveiling Contextual Insights
‘Compare’ isn’t just about comparing numbers; it’s about revealing context. For example, while analyzing turnover rates, you might find that turnover spikes among women during specific months. This can trigger further investigation into underlying causes. ‘Compare’ is versatile, working across departments, roles, time periods, and performance indicators, allowing you to explore various aspects of your data.
Let’s take this example for a spin! Click on the interactive tour below.
Just like that you can generate a beautiful visualization that compares your turnover rate between men and women in 2022!
Your end result will look similar to: