

Release date: December 14, 2023
Quarterly Data Visualization
We are excited to introduce a new feature that’s now part of the Employee Cycle experience – Quarterly Data Visualization.
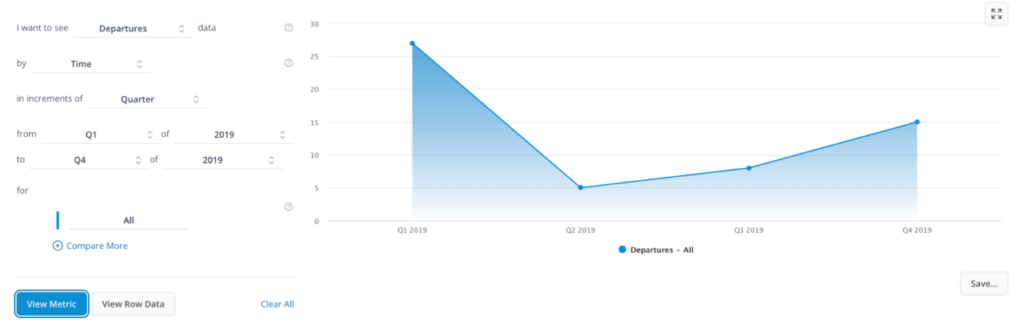
Our latest feature allows you to visualize your HR data by quarters. This means you can now generate and view metrics with a more refined, quarterly lens. This addition to our Find Metrics tool brings a new dimension to your data analysis, enabling you to:
- Deep Dive into Quarterly Trends: Understand how your workforce evolves each quarter. Spot trends, identify patterns, and make informed decisions based on detailed, timely data.
- Enhanced Reporting: Quarterly reports just got easier and more insightful. Generate reports that reflect the unique dynamics of each quarter, providing a more nuanced view of your HR landscape.
- Strategic Planning Support: Align your HR strategies more closely with business cycles. Use quarterly data to plan better, respond faster, and strategize with greater precision.
Thank you for choosing Employee Cycle as your partner in HR analytics. We’re excited to see how Build Reports will enhance your data journey.
Happy Analyzing!