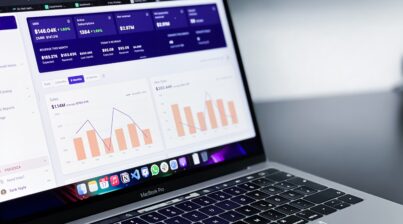
Everyone loves graphs. They are like pictures, right? You know what “they” say: “A picture is worth 1000 words!” But, then again, is it? Fred Barnard used this phrase in the 1920 which he adjusted from a Chinese philosophy. However, we know today’s digital age allows manipulations to fool people. So, can we trust the images? Do we need to be smarter than those who seek to manipulate images to provoke emotional reactions? Who has time for that? We need trusted sources, even with data.
Digital graphs that reflect information about the productivity and health of your workforce can also elicit emotions and we may not even realize it. It’s human nature. So, how can we take the emotion out without losing the humanity?
The first key is to realize if you are having an emotional reaction. It might be that you feel a flush come to your face or your heart might speed up. These reactions can be positive or negative. You might need to think about if you had expectations prior to reviewing the statistics. An initial emotion, one way or the other, may be a subconscious skewing of the data to what you expected to see. Such as, “Yes! Our retention numbers are up! I knew the health benefits tweak would convince workers to stay.” But, did it?
The second step would be to take a few moments to understand the source of your data. You may have asked for retention numbers and left the data gathering up to someone else. If you don’t understand what data they asked for, you may not have the data to support your emotional reaction.
For example:
- Are you stopping to ask or investigate what the data is based on?
- Is it purely just a statistic from the one month to another?
- Is the data showing a positive trend over a longer time period?
- Is the data based on employees asked about their decision to withdraw resignation paperwork?
These is not to say that analytics are worthless. Far from it! Analytics have come a long way and are easier than ever to tailor to your questions. They can aid you in maintaining a healthy workforce. You don’t need a computer degree or a personnel degree to be able to use them. If you have a specific question about your workforce, the analytics can be produced to help provide you data. However, the data and the pictures they provide are tools. Remember that they don’t take the “Human” out of “Human Resources.”
We recently launched our People Dashboard to bring all your people metrics into one place. Click to schedule a demo and learn more.


